
Managing your business operations would be challenging without proper metrics and data analytics. This statement is specifically true in Logistics, which involves supply chain and transportation. In particular, it would be difficult to manage the process and evaluate the success of your organization without quantifiable KPI and benchmark.

Knowing what and how to measure is the first essential step in management. Below are 5 significant metrics in Pickup & Delivery Logistics that any company can use to measure their performance in meeting initial goals.
1. On-Time Pickup Percentage
On-time pickup percentage is calculated by dividing the number of pick-ups made on-time by the total number of shipments in a certain period. This is a measurement of freight carrier performance and its effect on your operations and customer service.
According to Supply Chain Consortium, the average on-time pickup percentage is 96% for several segments. More than 40% of companies reached their goal performance,which ranges from 95-100%.
For companies, on-time pickup percentage gives you further insights such as which carriers or lanes are causing issues or how they affect the sales of a product. For shippers, they will be able to see the timeliness of carriers and how it impacts delivery schedules.
An accurate measure of failed pick-up times helps identify problems in an early stage, keeping untimely behaviors from affecting product delivery.
2. Perfect Shipment Measurement
This metric can also be called Perfect Order Measurement. It measures what percentage of your orders are without errors. To put it simply, the goal is to hone your delivering process by finding and eliminating defects incrementally until that number falls to zero. With perfect order measurement, managers will be able to identify any causes of failures.

3. On-Time Delivery Adherence
Also called Must-Arrive-By-Date (MABD) Adherence, this metric shows the average of delivering on time against the date required by customers. For retail vendors, this metric is particularly crucial, since they may have to pay a penalty for orders that show up late.
There are different ways to use this metric, as it can be expanded to indicate what percentage of items are delivered on time, the value of those that are, and how early or late they are. Smaller metrics can either be measured separately or rolled into one longer-spanning metric. On-time delivery adherence assists you in monitoring and tracking, so that you can increase the efficiency of your supply chain.
4. Freight Bill Accuracy
Freight bill accuracy is calculated by dividing the number of error-free freight bills by the total number of freight bills in a period. Errors may include incorrect pricing, incorrect weights, incomplete information, etc. This metric is generally measured in total and for each carrier.
The average billing error rate is 3%, which makes the freight bill accuracy percentage 97% accordingly.

Measuring charges on freight bills allows you to identify any issues that could go unnoticed without attention. Managers can, therefore, identify issues in an early stage and take action to resolve them, so as to avoid unnecessary fees and charges, thus lower transportation costs. The more error-free your freight bills and payments, the more net profit you gain.
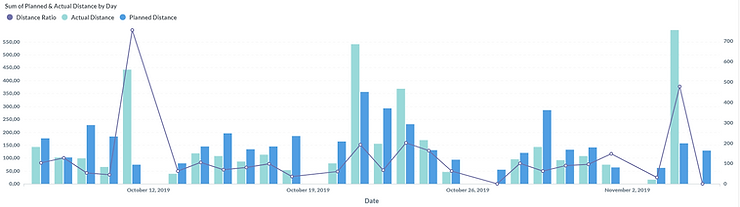
5. Transit Time to Distance
This metric equals the number of days (or hours) from the time a shipment leaves your facility to the time it arrives at the customer’s location. Transit times can vary substantially, based on freight mode and carrier systems, for a given distance or lane. By monitoring transit time, you can optimize capacity and figure out what factors may affect the attraction of drivers and carriers, thus, decrease it when possible.

After benchmarking the average transit time from your warehouse, you can precise it more easily. For example, instead of saying that an order will arrive in 1-5 business days, you can specify it to 4-5 business days. This can also be applied to the delivery hours. By implementing this tactic, you may increase your order picking accuracy rate and avoid returns.
Those are the 5 most common metrics in Pickup & Delivery Logistics that you can apply to measure your operations and take action to improve them. Excellent monitoring leads to smart decisions, better cost control, more revenue, and more profitability.
However, unless you are integrated into your customers’ systems, you will have to rely on freight carriers to report their own performance. Understanding this common difficulty, ABIVIN offers an interactive dashboard with insightful detailed reports about delivery key metrics, deliverymen's performance, traffic map, or distribution heat map - all in one place.
Click here and automate route planning with Abivin vRoute!
Reference
1. Core Benchmarks: Transportation
https://www.supplychainconsortium.com/Leadership-Forum/2009/GetPresentation/Session-4-Core-Benchmarks-Transportation-Operations
#logistics #supplychainmanagement #english #abivin #metrics #KPI #routeoptimizationsoftware
Top 5 Metrics & Benchmarks To Measure In Pickup & Delivery Logistics