
One of the top tasks for supply chain managers is to monitor the efficiency of delivery operations. Issues such as low load on vehicles and multiple delivery points can always be a headache for managers. How can we know if we have optimized the delivery process to the fullest? If not, where is the problem? Abivin hopes that the following 5 indicators can help managers find the solution to this tough problem.
Let's examine each indicator with Abivin to see how they impact the delivery efficiency of the fleet:
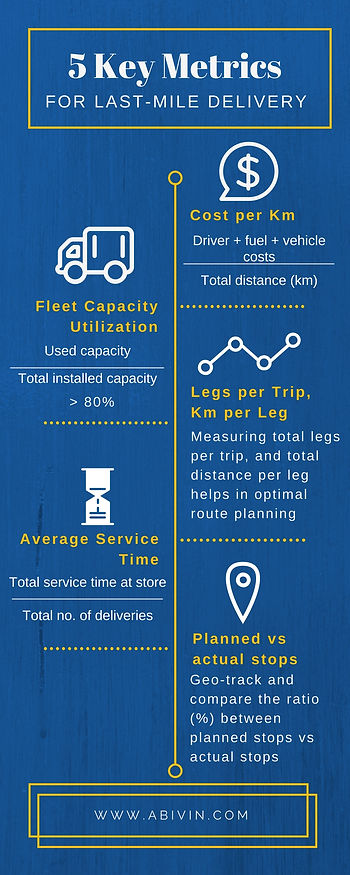
1. Cost per Km
The Cost/Km ratio is an easy way to determine the cost required for each km driven. The simple formula can be presented as:
(Driver's wage + Fuel costs + Vehicle costs) / Total operational km
For example, if a vehicle travels 100 km in a day, the driver is paid 5 USD, the fuel cost is 20 USD, and the vehicle maintenance cost is 15 USD, then the Cost per Km can be calculated as follows:
(5$ + 20$ + 15$) / 100km = 0.4$
We can see that the Cost per Km in this case is 0.4 dollars. In other cases, the cost may increase or decrease depending on driving skills, fuel consumption, repair costs if any, or actual distance. For logistics managers, managing this information is crucial to adjust and optimize the Cost per Km.
2. Fleet Load Capacity
Every logistics professional wants to utilize the maximum load capacity of the delivery fleet as close to 100% as possible. The metric to assess the ability to utilize maximum load is called the Fleet Load Capacity Ratio. For a fleet with a total designed load of 3,000 kg and an actual used load of 2,500 kg, the fleet load capacity ratio is:
Fleet load capacity ratio: 2500 kg / 3000 kg = 0.83
Through many years of working with supply chain managers, our experience shows that an acceptable load capacity ratio should be 80% or higher. Companies must track actual data on the fleet's cargo carrying capacity, as any estimation not based on actual figures can lead to reduced productivity and increased costs.
3. Number of Routes per Trip, Km per Route
Each route is a part of the delivery route, representing the distance between two consecutive delivery points. Typically, it is the distance between stores where the driver delivers. The route number metric can help managers compare, modify, and adjust the daily delivery plans of each driver. For example, there are 2 drivers, each with 2 trips and the same number of stores but different route lengths:
Driver 1:
- Trip 1 is 18 km with 3 stores;
- Trip 2 is 25 km with 5 stores.
Thus, the vehicle runs: 8 (stores) / 2 (trips) = 4 (routes/trip)
Km/route: (18km + 25km) / 8 (routes) = 5.4 (km/route)
Driver 2:
- Trip 1 is 25 km with 4 stores;
- Trip 2 is 33 km with 4 stores.
Thus, the vehicle runs: 8 (stores) / 2 (trips) = 4 (routes/trip)
Km/route: (25km + 33km) / 8 (routes) = 7.3 (km/route)
Although both drivers have the same number of routes (8) in their trips, driver 2 has to travel farther than driver 1. This needs to be considered when managers optimize routes and compensate drivers.
4. Average Service Time
Average service time can be defined as the average time needed to serve a customer. In supply, it is the time to unload goods at each store during the journey. To calculate, we take the total service time at stores divided by the total number of deliveries.
For example:
Monday: 15 minutes
Tuesday: 20 minutes
Wednesday: 18 minutes
Thursday: 15 minutes
Friday: 15 minutes
Thus, the average service time at that store in a week is:
(15 + 20 + 18 + 15 + 15) / 5 = 16.6 (minutes)
This number needs to be kept stable, as erratic changes will make it difficult to accurately plan each delivery trip.
5. Planned Stops vs. Actual Stops
In reality, the journey of the vehicle does not always match the pre-set plan. In some cases, the driver may make unplanned stops for rest, meals, or even to pick up and drop off children. Each time the driver makes such a stop, they deviate from the overall plan and reduce the quality of delivery service. We can avoid this issue by tracking the ratio of planned stops to actual stops.
-
Actual stops: 58
-
Planned stops: 50
- Ratio: 86%
In the above example, although the driver was only allowed to stop 50 times according to the plan, he actually stopped 58 times. That's why we need this number to control things beyond the plan.
With the rapid pace of urbanization accompanied by many traffic issues such as winding roads, rush hour congestion, rising fuel prices..., optimizing delivery routes is a key issue that all modern supply chain managers must solve. Along with these issues, continuous technological advancements help make the manager's job easier. At Abivin, we want to make your delivery management job light and quick by creating a tool to optimize your delivery process and fleet productivity.
Register for a free trial of Abivin vRoute - Optimal Delivery Management Software.
Five Key Metrics in Delivery Management for Logistics Managers